Kindergarten - Interactive Plotting GUI for Python Notebooks
Note: Kindergarten was just released, so I’m sure there’s loads of bugs - please do open an issue on GitHub if you find any.
I frequently use Python Jupyter Notebooks, and usually do something like this:
- Load some data
- Clean the data, make some basic transformations
- Try to understand something about the data
- Do whatever task with the data
In my experience, steps 1 and 2 are mostly fine - I usually use pandas and its ecosystem, which handles loading, cleaning, and transforming data with straightforward APIs. What I do in step 3 (sometimes called Exploratory Data Analysis (EDA)) really depends on the data and task, however, it almost always includes lots of plotting. And I cannot for the life of me remember the APIs of common plotting libraries such as matplotlib and plotly.
For example, this is what you need to do if you want use a custom title font size and marker type in a plotly scatter plot:
import plotly.express as px

df = px.data.iris()
fig = px.scatter(
    df, x="sepal_length", y="sepal_width", color="species",
    title="Custom Title"
)
fig.update_layout(
    font_size=25
)
fig.update_traces(
    marker_symbol="triangle-up"
)

fig.show()
It’s not horrible, and it’s also not too difficult to figure out with some googling. However, it forces me to do a context switch to read the plotly reference and some stackoverflow posts almost every time I want to plot anything, which decreases productivity.
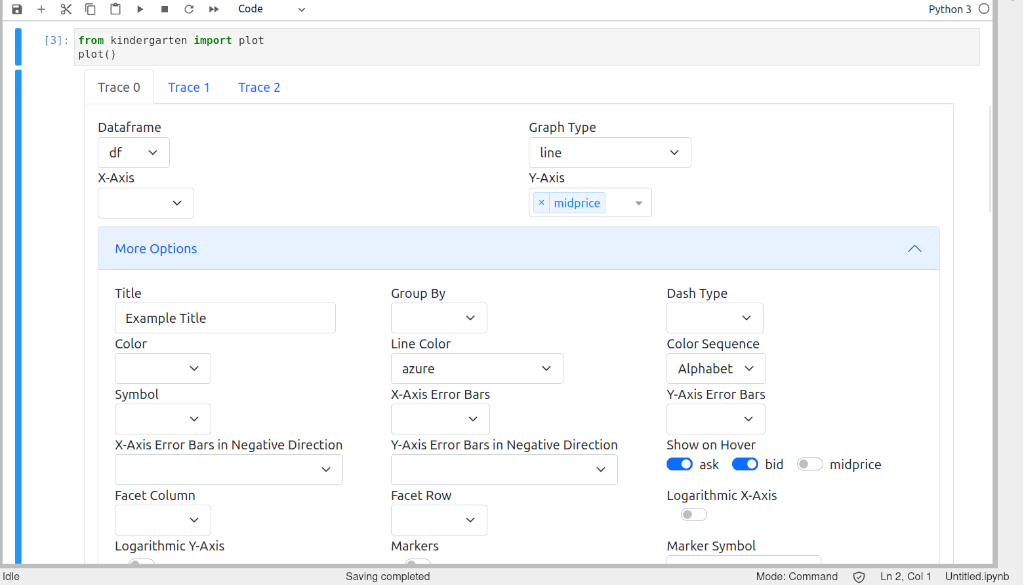
Plotting in Jupyter Notebooks is of course inherently visual though, and these notebooks provide powerful features for inline display of media. Thus, I decided to build kindergarten so I hopefully have to spend much less time searching for and copy-pasting plotting code. It’s a GUI built on top of the awesome plotly and covers a fairly large part of its API. It allows for interactively plotting pandas dataframes and includes support for several traces in a single plot and allows exporting the code that generates the plot.
Here it is in action:
With several traces:
You can install it with pip install kindergarten and then just
from kindergarten import plot
import pandas as pd

df = pd.DataFrame({"x": [1, 2, 3], "y": [4, 5, 6]})
plot()
If you need a different number of traces, you can specify the number with plot(num_traces=10).
The most similar library I’ve found is bamboolib which supports many more EDA functionalities than just plotting, but they were acquired by Databricks and aren’t open-source anymore :( .
Roadmap
I’ll probably try to cover some more parts of the plotly API, and I’ve been wanting to do a stackoverflow search for the most viewed python plotting questions to make sure kindergarten supports most common use cases. In the long run, it would be awesome to add support for other parts of the EDA workflow like data transformation and cleaning.
Kindergarten is open-source and MIT licensed, so feel free to contribute to the repo!
Some Implementation Details
Maybe someone’s interested in how the library works under the hood:
The GUI is a dash application that uses jupyter-dash to run inside Jupyter Notebooks. The different options (title, x-axis, …) are all subclasses of the abstract GraphOption and are generated at runtime using an abstraction that makes it straightforward to add new options. For example, this is how the title and marker_symbol keyword arguments are implemented:
Title = build_text_graph_option(
    _keyword="title",
    _label="Title",
)

MarkerSymbol = build_select_graph_option(
    _keyword="marker_symbol",
    _label="Marker Symbol",
    _select_options_callable=lambda self: [NONE_OPTION] + to_options(MARKER_SYMBOLS),
    _is_px_keyword=False,
    _valid_graph_types=("scatter", "line"),
)
The different options are collected and assigned to graph types at runtime - python’s strong support for reflection and introspection makes implementing this painless:
GRAPH_OPTIONS: Tuple[Type["GraphOption"], ...] = tuple(GraphOption.__subclasses__())
SUPPORTED_GRAPH_TYPES = ("line", "scatter", ...)  # shortened
UNSUPPORTED_PARAMS = {"animation_group", "category_orders", ...}  # shortened

param_to_graph_types = collections.defaultdict(set)

for graph_type in SUPPORTED_GRAPH_TYPES:
    signature = inspect.signature(getattr(px, graph_type))
    for param in signature.parameters.keys():
        if param not in UNSUPPORTED_PARAMS:
            param_to_graph_types[param].add(graph_type)

for graph_option in GRAPH_OPTIONS:
    graph_option.valid_graph_types += tuple(param_to_graph_types[graph_option.keyword])
The Kindergarten class in core.py owns the Dash app and defines the callbacks allowing for interaction. Each trace is owned by one Tab (in tab.py) that keeps track of the dataframe, graph type, and keyword arguments of its trace.
One feature that took me some time to get right is automatically populating the dataframe dropdown with all pandas dataframes that are available in the notebook. This enables users to simply call plot() and then find the dataframe they want to plot in the dropdown instead of having to specify what dataframes to plot explicitly with plot(df_1, df_2, ...). Here’s the code I ended up with to get the names of all pandas dataframes in the notebook:
import __main__

dataframes = [
    var
    for var in dir(__main__)
    if isinstance(getattr(__main__, var), pd.DataFrame)
]
And here’s how the Tab class generates it’s figure:
def figure(self) -> go.Figure:
    if not self.has_figure():
        return go.Figure()

    px_kwargs, update_traces_kwargs, _ = self._figure_kwargs()

    import __main__

    fig = getattr(px, self.graph_type)(getattr(__main__, self.df_name), **px_kwargs)
    fig.update_traces(**update_traces_kwargs)

    return fig
The Kindergarten class combines all tabs’ figures into the one that’s then displayed:
def _figure(self) -> go.Figure:
    fig = make_subplots()

    for tab in self.tabs:
        f = tab.figure()
        fig.add_traces(list(f.select_traces()))
        fig.update_layout(f.layout)

    for tab in self.tabs:
        fig.update_layout(tab.layout_kwargs())

    return fig
Finally, the Print Code button that prints the exact code needed to produce the figure the GUI shows makes extensive use of python f-strings; It looks something like this:
def _on_print_code():
        s = f"""
import plotly.graph_objs as go
from plotly.subplots import make_subplots
import plotly.express as px

fig = make_subplots()
"""

        for tab in self.tabs:
            if tab.has_figure():
                varname = f"trace_{tab.tab_id}"
                s += f"""
{tab.figure_str(varname)[:-1]}
fig.add_traces(list({varname}.select_traces()))
fig.update_layout({varname}.layout)
"""

        for tab in self.tabs:
            if tab.layout_kwargs():
                s += f"\nfig.update_layout(**{tab.layout_kwargs()})"

        s += "\nfig.update_layout(showlegend=True)"
        s += "\nfig.show()"
        print(s)